Custom dashboards your users never leave your product for
BI tools live in a separate app — every trip to check a dashboard kills momentum. We build real-time, AI-native dashboards embedded in your product, on your data model, designed for the decisions your team and your customers actually make. Data-heavy is our strength.
Of software vendors now build analytics into their SaaS products
A dashboard is only as good as the decisions it enables
Most dashboards fail not because the charts are wrong, but because they display data instead of driving decisions. A wall of metrics nobody acts on is just expensive decoration.
A useful dashboard answers a specific question for a specific person at the moment they need to act: which accounts are about to churn? which orders are behind SLA? is revenue tracking to plan? We build dashboards backward from those decisions — start with the action the user needs to take, then design the view that makes the answer obvious. No digging through tabs, no exporting to spreadsheets, no waiting for the weekly report.
That decision-first approach is also why we don’t just reach for a generic BI tool. The dashboards that actually change behavior are the ones built into the product where the decision happens, on the data model that reflects how your business actually works. The rest of this page is about that difference.
Custom dashboard vs a BI tool — the real choice
The honest comparison. Your alternative to a custom dashboard usually isn’t “nothing” — it’s Tableau, Power BI, Looker, or Metabase. Here’s the trade-off.
Custom embedded dashboard versus a BI tool versus a BI tool embedded via iframe, across location, design fit, data model, context-switching, multi-tenancy, AI, licensing, and timeline.
Custom embeddedwhat we build
BI toolTableau / Power BI / Looker
BI tool, iframeembedded
Where it lives
Inside your product
Separate app users log into
In-product, but via iframe
Looks like your product
✓ Pixel-matched
✗ It’s a different app
◐ Often looks out of place
Built on
Your data model + decisions
Whatever you pipe in
Whatever you pipe in
Context-switching
None
Constant — kills momentum
Reduced, UX seams remain
Customer-facing / multi-tenant
✓ Native, white-labeled
✗ Not designed for it
◐ Limited, license-gated
AI-native (ask-your-data)
✓ Built in (text-to-SQL)
◐ Add-on, varies
◐ Add-on, varies
Per-seat licensing
None — you own it
Yes, scales with users
Yes, expensive at scale
Time to first dashboard
Weeks
Days (internal/standard)
Days–weeks
Best for
Customer-facing, product-embedded, unusual data models
Internal ad-hoc analysis
Quick internal embeds
Verdict
When the dashboard is part of your product
For internal data-team exploration
For quick design-flexible embeds
swipe to compare →
We’ll say it plainly: if you need internal ad-hoc analysis for a data team, a BI tool like Metabase or Power BI is often the faster, cheaper call — and we’ll tell you so. Custom dashboards win when the dashboard is part of your product (especially customer-facing), when it must match your design, when your data model is non-standard, or when per-seat BI licensing has gotten out of hand.
Why analytics is moving into the product
The whole category is shifting from “log into a separate dashboard” to “insight where the work happens.” Two data points explain why.
Chart 1 · Market
Embedded analytics market · 2025 → 2035
swipe to see the full chart →
The embedded analytics market roughly quadruples by 2035, growing ~16% a year — driven by demand for real-time insight inside operational apps, not a separate tool.
Prefer embedded analytics over standalone dashboards (by 2026)
80%
Enterprises shifting from standalone BI to embedded
68%
Software vendors building analytics into SaaS
70%
New embedded deployments incorporating AI insights
60%
Users increasingly want answers inside the product they’re already in — and vendors are responding. The standalone-dashboard era is giving way to embedded, AI-native analytics.
“Dashboard” spans very different products with different demands. Knowing which you need shapes the whole build.
Executive dashboards
High-level revenue, growth, and KPI visibility for leadership. The job: answer "how are we doing?" at a glance, with drill-down when the answer raises a question.
Operational dashboards
Real-time monitoring for ops teams: workloads, SLAs, queue depth, system health, throughput. The job: surface the thing that needs action right now.
Customer-facing dashboards
Branded analytics your customers see inside your product — their usage, their reports, their account activity. The job: make your product stickier (and often, something you can charge for).
Embedded analytics
Dashboard capabilities woven directly into your existing application so users never leave for insight. The job: eliminate context-switching entirely.
AI-native dashboards
Dashboards you query in plain language, that surface anomalies and generate narrative insight automatically. The job: move from "charts you read" to "questions you ask."
AI-native dashboards: from charts you read to questions you ask
The dashboard is evolving. Instead of hunting through pre-built charts for the answer, users increasingly just ask. We build that capability in — with Claude in the loop.
Ask your data in plain language
Text-to-SQL: "show me overdue invoices from logistics vendors this quarter" → the dashboard generates the query, runs it, and shows the answer. A semantic layer guides the AI so answers are accurate, not plausible-but-wrong.
Automated insight generation
The dashboard surfaces what changed and why — "revenue is up 12%, driven mostly by the enterprise segment" — instead of making the user spot it.
Anomaly detection
The system watches the metrics and flags the unusual: a churn-signal spike, an order stuck past SLA, a transaction pattern that doesn’t fit. It tells you where to look.
AI-generated narratives
Turn a chart into a sentence. For executive and customer-facing dashboards, a plain-language summary alongside the visualization makes insight accessible to non-technical stakeholders.
AI-native isn’t a bolt-on for us — we’re an AI-first agency that ships custom products with Claude Code and AI agents on every project. See our AI-enabled tools and RAG pages for the adjacent capabilities.
Data-heavy interfaces are what we’re known for
Anyone can drop a pie chart on a page. The hard part is a dashboard that renders 100k rows without freezing, cross-filters a dozen charts off one control, and stays readable under real operational density — the same data-heavy design strength behind our UX/UI practice.
Sortable, filterable, paginated tables with sticky headers, frozen columns, inline editing, and bulk actions — built to render large datasets without choking the browser.
Cross-filtering dashboards
Multi-chart layouts where every visualization responds to one shared filter set, with drill-downs, time-range pickers, and saved views.
Custom chart components
When the standard charting library can’t express what your data needs — custom interactions, annotations over time series, cross-chart brushing.
What we build into a dashboard
Real-time data streaming
Live updates via WebSockets, polling, or streaming — the right method for your source and performance budget. No stale weekly reports.
Interactive visualizations
Charts, graphs, maps, and tables with drill-downs, cross-filtering, time-range controls, and brushing — complex data legible at a glance.
Multi-source integration
Databases, APIs, spreadsheets, CRMs, ERPs, and SaaS platforms into one pane of glass. If it’s accessible programmatically, we connect it.
Customer-facing & multi-tenant
Branded, white-labeled dashboards your customers see inside your product, with strict per-tenant data isolation.
Role-based access & drill-down
The right view for each role, with permission-aware drill-downs so users see exactly what they should — and nothing they shouldn’t.
Alerting & thresholds
Notify the right person when a metric crosses a line — the dashboard reaches out instead of waiting to be checked.
AI-native querying
Ask-your-data in plain language, automated insights, anomaly detection, AI-generated narratives. Built with Claude.
Performance at scale
Dashboards that stay responsive under real density — 100k+ rows, dozens of charts, large time ranges — without freezing the browser.
The stack we build dashboards on
The right tools per layer — visualization, real-time data, integration, and the AI layer.
Front-end & visualization
Next.js + Reactthe dashboard app, embedded in your product
D3, Recharts, Chart.js, EChartsthe right charting layer per need
TanStack Table / AG Gridlarge, interactive data tables
Tailwindpixel-matched to your product’s design
Data & real-time
PostgreSQL + read replicasthe query backbone
WebSockets / SSEreal-time streaming
Materialized views / cachingspeed at scale
Supabaseour standard backend
Integration & pipelines
REST / GraphQL connectorsto any programmatic source
CRM / ERP / SaaS APIsStripe, HubSpot, and more
Custom ETLwhen data needs shaping before display
AI layer
Claudetext-to-SQL, narratives, anomaly detection
Semantic layerfor accurate natural-language queries
Claude Codethe build methodology behind 3× speed
When a BI tool is the better call — and we’ll say so
If you need internal, ad-hoc analysis for a data team that wants to slice data freely and build its own reports, an off-the-shelf BI tool — Metabase (open source), Power BI, or Tableau — is usually the faster, cheaper choice, and we’ll tell you that on the scoping call. Those tools are excellent at exploratory internal analytics.
Custom dashboard development earns its cost when the dashboard is part of your product — especially customer-facing or multi-tenant — when it has to match your design exactly, when your data model is non-standard, when AI-native querying is core to the experience, or when per-seat BI licensing has become a tax on your growth. The most expensive custom dashboard is the one that should have been a Metabase instance.
Real founders who hired NerdHeadz for the hard data work.
On shipping dashboards their teams and customers actually use to decide.
01 / 07
“
This system has been a dream of mine for almost a year. I have tried to build it myself and finally came to the conclusion I needed help. The NerdHeadz team has built me exactly what I was dreaming about and more! Working with them has been an absolute pleasure. I can't thank them enough.
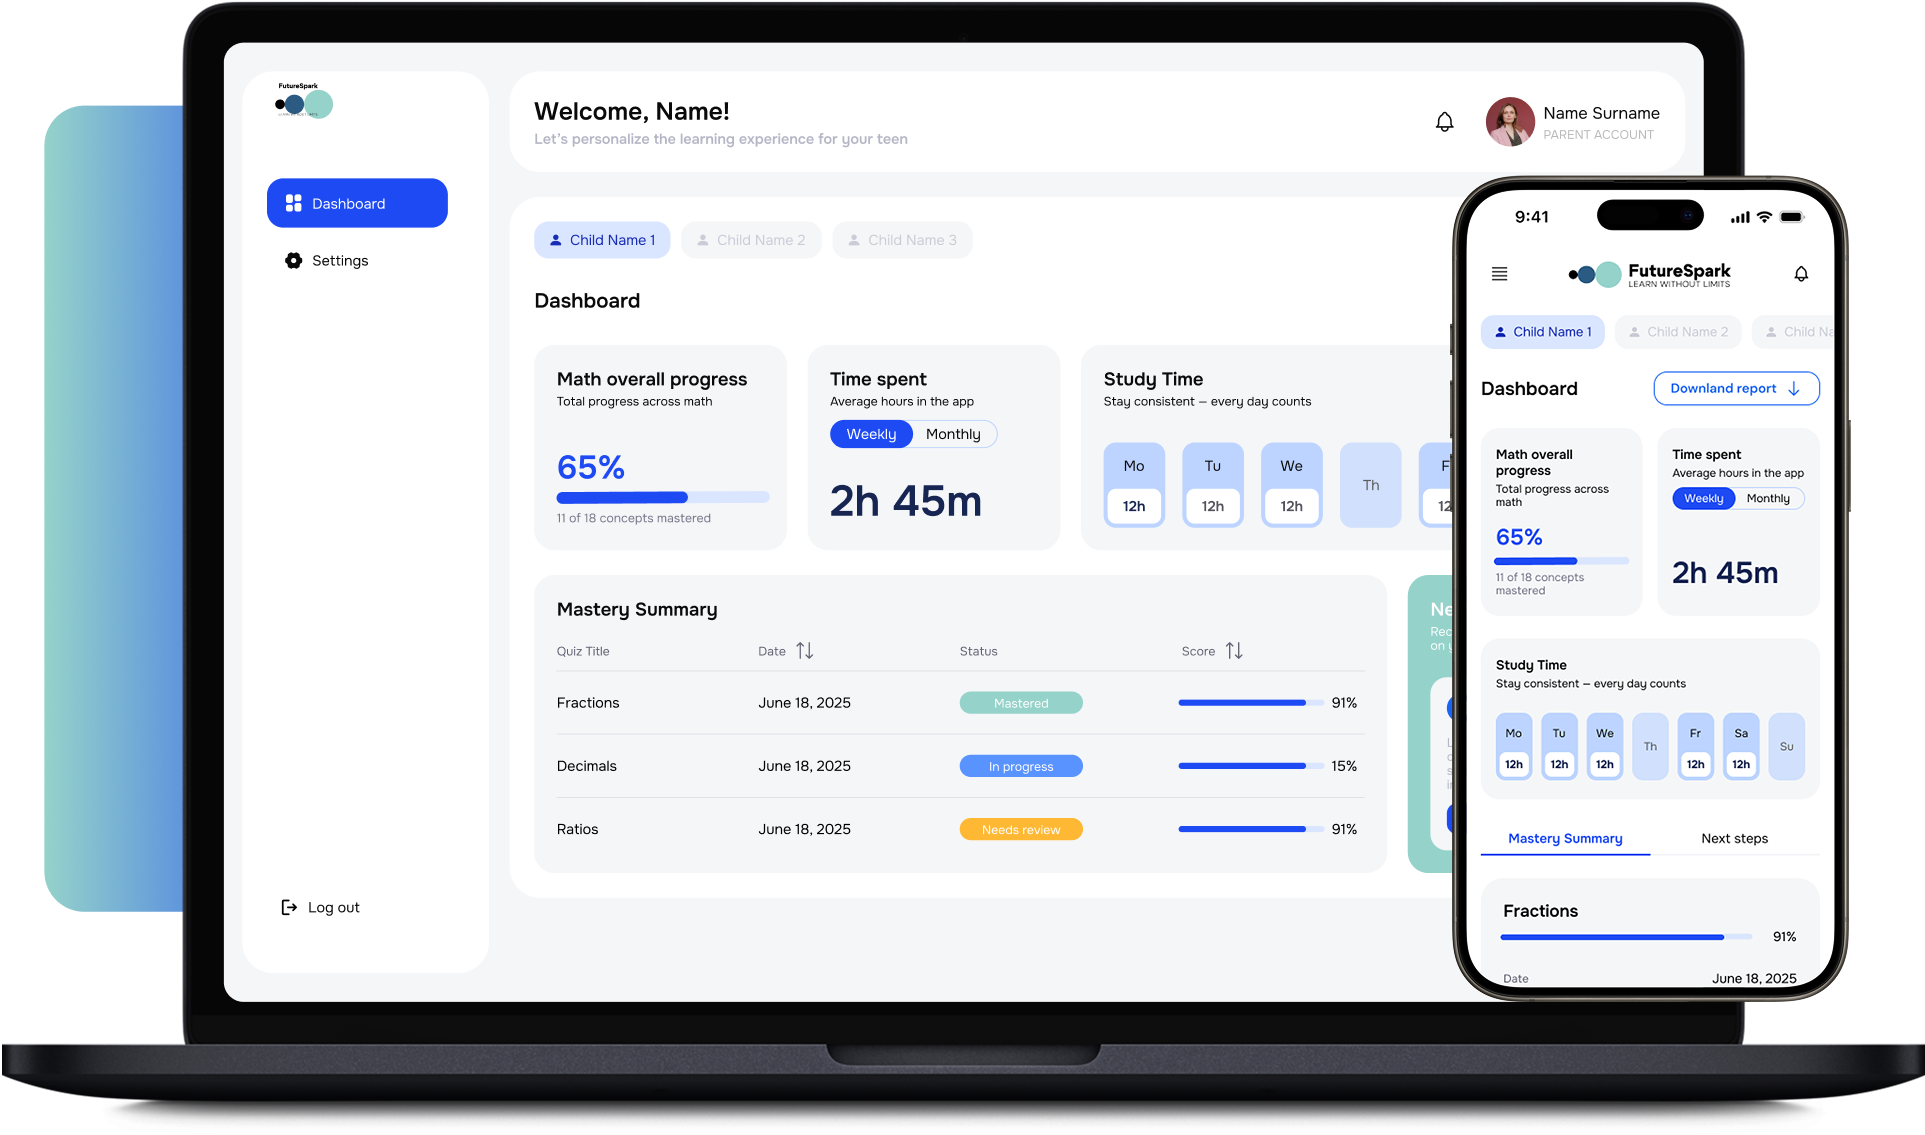
Your users never leave your app to check a dashboard. We build analytics into the product, pixel-matched to your design — not an iframe that looks like a different app.
Data-heavy is our strength.
100k-row tables, cross-filtering dashboards, custom chart components that don’t choke under real density. The same data-heavy design strength behind our UX/UI practice.
AI-native by default.
Ask-your-data in plain language, automated insights, anomaly detection — built in with Claude, because we’re an AI-first agency. The dashboard answers questions, not just displays numbers.
Built backward from decisions.
We start with the action the user needs to take, then design the view that makes the answer obvious. A dashboard nobody acts on is decoration — we build for the decision.
Frequently asked questions about dashboard development
A custom dashboard is analytics built into your own product, on your data model, designed for your specific decisions. A BI tool (Tableau, Power BI, Looker, Metabase) is a separate application your users log into to explore data. The key difference: a custom dashboard eliminates context-switching — users get insight without leaving your product — and it matches your design exactly, which BI-tool iframe embeds rarely do. BI tools are great for internal ad-hoc analysis; custom dashboards win when analytics is part of your product.
If you need internal, exploratory analysis for a data team, a BI tool is usually faster and cheaper — and we’ll tell you so. Build custom when the dashboard is customer-facing or multi-tenant, when it must match your product’s design, when your data model is non-standard, when AI-native querying is core, or when per-seat BI licensing has become expensive at your scale.
Yes. We build real-time or near-real-time refresh using WebSockets, server-sent events, polling, or streaming connections, depending on your data source and performance requirements. For high-frequency data we add caching and materialized views so the dashboard stays fast.
Yes — that’s our core approach. We build embeddable dashboard components that integrate natively into your web or mobile app with your branding, design system, and access controls. Unlike BI-tool iframe embeds, a custom embedded dashboard looks and behaves like part of your product.
Yes. We build branded, multi-tenant customer-facing dashboards with strict per-tenant data isolation — each customer sees only their own data. Customer-facing analytics makes your product stickier and is often something you can charge more for; over 70% of SaaS vendors now build analytics into their offerings.
Databases (PostgreSQL, MySQL, MongoDB), APIs (REST, GraphQL), spreadsheets, cloud services, CRMs, ERPs, payment systems, and SaaS platforms. If your data is accessible programmatically, we can bring it into the dashboard — and shape it with custom ETL where it needs cleaning or aggregation first.
Yes — this is the AI-native capability we increasingly build in. Using text-to-SQL with a semantic layer for accuracy, users can ask "show me overdue invoices from logistics vendors this quarter" and get the answer without building a report. We also build automated insight generation, anomaly detection, and AI-generated narratives, all with Claude in the loop.
A focused dashboard (a defined set of views, a few data sources, real-time refresh): $20k–$60k. A full embedded analytics suite (multi-tenant, customer-facing, AI-native querying, many sources): $60k–$200k+. After scoping, you get a fixed-price quote. For internal-only exploratory analytics, we may recommend a BI tool instead — it could cost a fraction.
A focused dashboard: 3–6 weeks. A full embedded analytics suite with multi-tenancy, AI querying, and many data sources: 8–16 weeks. We deliver in phases so you’re using the first views early rather than waiting for everything at once.
Yes — this is a core strength. We build for performance at scale: 100k+ row tables, dozens of charts, large time ranges, all staying responsive. Techniques include server-side pagination and aggregation, materialized views, caching, virtualized rendering, and read replicas. Data-heavy interfaces that stay fast are exactly what we specialize in.
Yes. We build threshold-based and behavioral alerting — the dashboard notifies the right person (via email, SMS, Slack, or in-app) when a metric crosses a line, so the system reaches out instead of waiting to be checked.
Analytics platforms like FutureSpark, plus the data-heavy dashboards, complex tables, and custom chart components across our portfolio — the same data-heavy design strength behind our UX/UI practice. We’ve built executive dashboards, operational monitoring views, customer-facing analytics, and embedded insight across multiple industries.
Sources & citations
Gartner via ThoughtSpot, embedded-analytics preference projection (80%+ by 2026)
Global Growth Insights, Embedded Analytics Market Report 2026
Luzmo / Domo, embedded-analytics tooling and iframe-design analysis 2026
NerdHeadz portfolio: FutureSpark and data-heavy dashboard work
Let’s scope
Ready to build a dashboard your users actually use?
30-minute scoping call. Tell us the decisions your dashboard needs to drive and where it should live. We'll come back with an approach, a stack, and a fixed-price quote — or an honest take on whether a BI tool would serve you better.